As the Moon moves through the sky, it passes in front of, or occults, stars in its path. It can be thought of as casting a shadow of each star, where the star is hidden behind the Moon. If the shadow of a particular star falls on the Earth, this star is occulted. As the shadow moves (due to the Moon's motion) across the Earth's surface, a region is defined from which the occultation of the star is visible. At the advancing edge of the shadow, the star is just disappearing at the Moon's edge. For most observers within the region of visibility of the occultation, the event (time from star's disappearance until its reappearance at the opposite edge of the Moon) will last a little more than an hour. North or south of the region of visibility of the occultation, the Moon will be seen to miss the star, passing close to it. Within a mile or two of the northern or southern boundary, or limit, of the region, a grazing occultation can be seen. Here the star will appear to pass along a line just touching (or tangent to) the edge of the Moon, and the star will disappear and reappear among the mountains and valleys along the Moon's edge for a period of a few minutes. Such a grazing occultation is a spectacular sight; at no other time, except perhaps during a solar eclipse, is the Moon's motion more apparent.
A grazing occultation is visible from a zone about usually about two miles wide, depending on the lunar topography, which can be predicted approximately from lunar charts. If several observers with telescopes and timing equipment are positioned at intervals across the zone, they can each time the sequence of disappearances and reappearances as seen from their location. If the positions of the observing locations are measured, the timings can be reduced afterwards to determine details of the lunar profile, and gives a very accurate fix of the position of the Moon relative to the star. Such observations are useful for refining knowledge of the positions and motions of stars, and can be used to improve parameters such as the tilt of the Earth's equator relative to the ecliptic (the plane of Earth's orbit around the Sun) and even the rotation of the Milky Way galaxy. Improvement of knowledge of the lunar profile for these observations aids the analysis of total solar eclipse timings, which can be used to study climactically important small changes in the diameter of the Sun over periods of many years. Also, the star's disappearances or reappearances may occur in steps, indicating a previously undiscovered close double star that can not be resolved by direct observations.
The location of the telescope should be described to an accuracy of about ten feet relative to landmarks (road intersections or large buildings) that are shown on the detailed topographic map of the area; the latitudes and longitudes of the observation sites can then be measured from the map by the expedition leader. Timings can be made by calling out the successive events (can use "D" for disappearance or "R" for reappearance; some are more comfortable thinking the star as a light that goes "off" and "on") and also tape recording a radio station. The best is to record the shortwave time
signals from station WWV at 5.0, 10.0, or 15.0 megahertz, but many observers do not have shortwave receivers. If the expedition leader makes arrangements for someone (not necessarily in the graze path) to create a master tape by recording WWV and a local AM or FM radio station, observers in the graze zone can record the agreed-upon local station with car or other radioes. A strong AM station is generally preferred since they can be received over long distances, but if reception of a particular FM station is known to be reliable throughout the area of observation, an FM station could be used. Camcorders are now almost as common as tape recorders and can be used in this case as tape recorders; the video is not needed. There are ways to hook sensitive video cameras to telescopes and some grazes, generally of relatively bright stars, have been recorded this way, but this is more advanced work. For bright stars, a camcorder can simply be held up to the eyepiece and, with a little adjustment, the graze can be recorded; this has been done successfully with a few previous grazes. Visual timings made to an accuracy of half a second are quite adequate for defining the lunar profile; for a graze, the observer's location is more sensitive than the timings, since observers even 50 feet apart will notice differences in their event timings.
Try to stress to new observers that making the observations is not that difficult. Besides observing the event, all they need is a tape recorder or camcorder to record their call-outs of the events, plus a background time reference, which could be an agreed-upon local AM or FM radio station, if a time-tagged master tape is prepared, as described above. It's more satisfying to even new observers to both observe a graze, and record it for comparison with records at adjacent sites to build up the profile, whose detail and accuracy is proportional to the number of stations recording data.
David W. Dunham, IOTA, 1996 April e-mail: dunham@starpower.net
An example of profile reductions:
This is an example of taking the information obtained from a grazing occultation, and making a visual
profile plot of the predicted predicted information vs. the observed information. The profile reduction is
drawn by Mr. Robert Sandy of Blue Springs Missouri.
Download Bellevue Pictorial
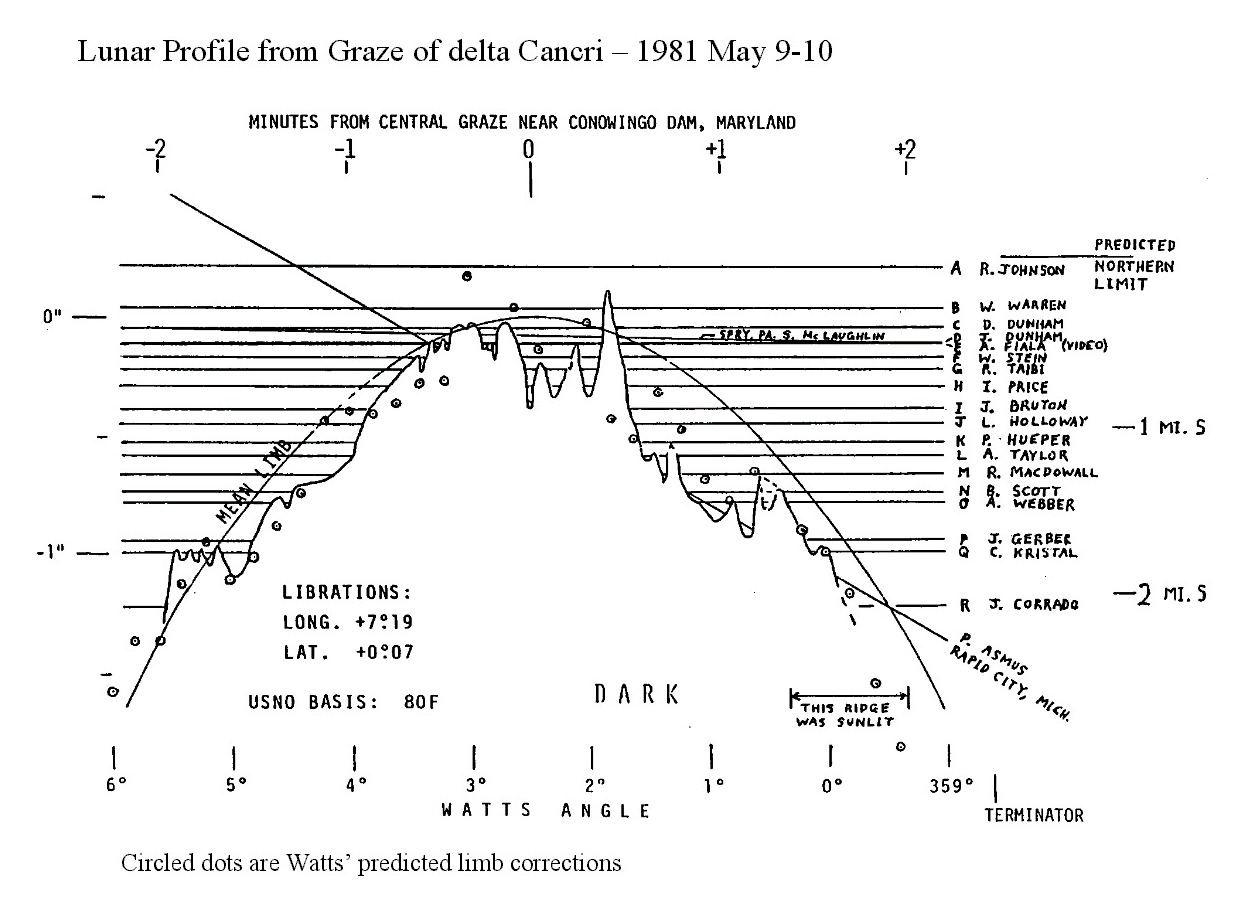
The chart below contains a sample lunar profile, as determined from the observations of 17 persons located
near Conowingo Dam, Maryland on 1981 May 10. In addition to providing a detailed profile of the lunar limb,
this graze yielded the first known video record of multiple events during a grazing occultation. The video
record shows 14 events that occurred during a time period of 62 seconds. Although the video camera provides
an aesthetically pleasing record of the events, most of the useful information about the lunar profile came from
the observations made by the fifteen visual observers. (Because the observations of a few distant observers
are shown on the profile, there are actually nineteen observers represented). Note how the paths of the distant
observers are rotated with respect to those of the local observers. The slopes of their paths are detemined by
computing the tangents of the differences between their position angles and the position angle at Conowingo
Dam, multiplied by the vertical amplification factor mentioned below. The reduced data are very consistent,
with only a few minor discrepancies. Rather than drawing the mean limb as a straight line, as is done for
most profiles, it is drawn here like a predicted profile. The verticle scale is shown on the left side (in seconds
of arc) and on the right side (in miles from the predicted limit); it is amplified by a factor 32 over the horizontal
scale, since the Moon moved a distance of about 180 km during the time between the disappearance and
reappearance at the southernmost station.
Download Original Size Delta Cancri Pictorial
Return to Main Index Page